In the industrial efficiency equation, Availability is noisy (a stopped machine screams), Quality is obvious (scrap piles up), but Performance is silent. Speed losses are the "silent killer" of plant productivity: systemic, cumulative and, all too often, accepted as "normal" by day-to-day operations.
For the Methods and Time Study Engineer, the challenge is not only technical but epistemological: How do we measure what the system does not record? This article examines the anatomy of speed losses, breaking down the discrepancy between the Ideal Cycle Time (ICT) and operational reality, through the lens of ILO standards and predetermined time systems (MTM/MOST).
What are speed losses in the OEE equation?
Technically, the Performance variable in OEE (Overall Equipment Effectiveness) responds to the following fundamental relationship:
The critical error in most industrial plants lies in the numerator. Speed losses occur when the equipment is running, but at a lower rate than its theoretical potential. Unlike Availability losses (breakdowns, changeovers), which are discrete, binary events (running/not running), performance losses are continuous.
To detect them accurately, real-time data capture systems are essential. MES software tools such as Induly are essential in this phase, since they make it possible to compare actual operating time against theoretical time for every manufacturing order, making visible the gap that the human eye cannot quantify on a continuous basis.
Taxonomy of the problem: Micro-stoppages vs. Reduced Speed
Following the methodology of the JIPM (Japan Institute of Plant Maintenance), we must split the problem into two distinct phenomena that require different engineering solutions:
1. Micro-stoppages (Idling/Minor Stoppages)
These are interruptions of the production flow that, because of their brevity, are usually not recorded on manual production logs.
- Definition: Stoppages typically shorter than 5 minutes (or 3 minutes under aggressive PLC configurations) that do not require specialized maintenance intervention.
- Invisibility: Without a connected telemetry system, these stoppages are diluted into operating time, inflating the denominator of the OEE and hiding inefficiency.
- Common causes: Jams in the feed, cleaning photoelectric sensors, or small readjustments by the operator.
2. Reduced Speed
This is continuous operation below the Design Speed or the Engineering Standard.
- Human Factor: In semi-automatic lines, this occurs when the operator's Activity (Pace) is below the 100 OIT scale (or 80 Bedaux, depending on the scale used).
- Technical Factor: Mechanical wear that forces a reduction in RPM to avoid vibration, or variability in the raw material.
The methodological error: Who defines the Ideal Cycle Time?
This is where the largest source of OEE overestimation lies. 75% of industrial companies calculate their performance based on false premises:
- Historical Averages: Using the previous year's average output as the standard. This only perpetuates past inefficiencies.
- Nameplate Speed: Using the manufacturer's nominal machine speed in processes where feeding is manual. This ignores human biomechanical constraints.
The Scientific Solution (MTM and MOST): The only valid Ideal Cycle Time for calculating OEE is one that has been scientifically validated. Predetermined time systems such as MTM (Methods-Time Measurement) or MOST make it possible to break the operation down into basic motions (Reach, Grasp, Position).
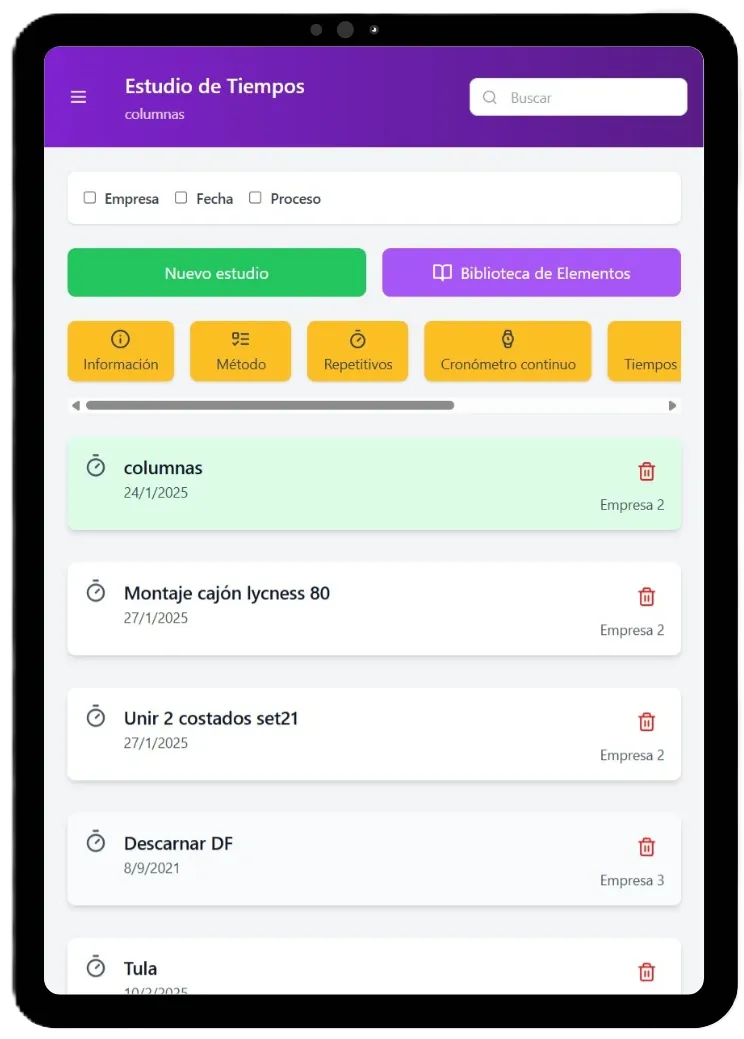
To validate these times and carry out accurate method audits, tools such as Cronometras enable engineers to conduct time studies with video analysis and digital time study, ensuring that the standard loaded into the system is achievable and ergonomic.
Industrial Reality: Speed loss data in Spain
Spanish industry frequently faces a considerable "Recording Gap" (indicative figures below):
- Overestimation: reported performance may exceed real performance (by around a factor of 1,2) due to lenient time standards (indicative example).
- Weight of Micro-stoppages: on high-cadence lines (packaging, automotive), micro-stoppages can account for a very significant share of total performance losses (depending on the line type; indicative example).
- Fatigue and Speed: there is a correlation between unmanaged fatigue and the drop in speed; operating efficiency in manual workstations tends to fall as the shift progresses (indicative example).
To diagnose whether this drop is due to fatigue or non-cyclical unproductive activities, sampling studies are recommended. Applications such as WorkSamp make it easy to carry out Work Sampling studies to scientifically determine the proportion of time devoted to productive activities vs. idleness or fatigue.
2025 Regulatory Framework: Digitalization and Ergonomics
Modern methods engineering must navigate between technical efficiency and labor and ergonomic regulations.
Industry 4.0 and the Single Source of Data
The trend toward 2025 is full integration. MES systems must be fed from predetermined time databases (MTM-UAS/MOST). Time study by sampling is no longer enough; continuous telemetry compared against a dynamic standard is required.
Ergonomic Constraints (ISO 11228 and ISO 14738)
OEE cannot be achieved at the expense of operator health. The biomechanical limits defined in the ISO standards act as the "hard cap" on the Ideal Cycle Time. Labor Inspection is monitoring the paces imposed by cobots and flow lines ever more closely. A time standard that violates fatigue recovery is, by definition, an invalid standard.
Technical Solutions to recover Performance
To combat speed losses, we propose three lines of technical action:
Audit and Recalibration of Standard Times: Validate the times configured in your SCADA. Use Cronometras to time the bottleneck operations with synthetic performance rating and OIT/TAL allowances (an MTM-2 or Basic MOST analysis is performed with specialized PMTS tools, not with the app). The goal is to align a 100 OIT Activity with an OEE Performance of 100%.
Automation and Videogrammetry: Configure your PLCs to capture stoppage events longer than 3 seconds (micro-stoppages). Cross-reference these data with industrial video surveillance systems to analyze the root cause without the need to be present on the line 24/7. Production control tools such as Induly can automate the collection of these events.
SMED applied to Speed: Apply SMED (Single-Minute Exchange of Die) principles not only to changeovers, but to the work cycle. Turn internal cyclic operations (which stop or slow down the machine) into external ones (performed while the machine runs at nominal speed).
Conclusion: Methods Engineering as the guardian of OEE
Performance is the exclusive responsibility of the Methods and Time Study department. Maintenance ensures that the machine can run; Methods ensures that it runs at the right speed.
In today's competitive landscape, indiscriminately increasing line speed is unsustainable and dangerous. The key to success lies in the surgical elimination of micro-stoppages and in stabilizing the process through robust work standards. Using advanced tools for sampling (WorkSamp), production control (Induly) and time analysis (Cronometras) is the only way to transform invisible data into tangible productivity.
Don't want to do it yourself? We do it for you from €800
If you prefer to outsource it, Cronometras delivers a complete time and motion study from a single video: elemental breakdown, OIT/TAL fatigue allowances, standard time with tolerances, and a report in PDF + Excel + JSON ready to present to management.