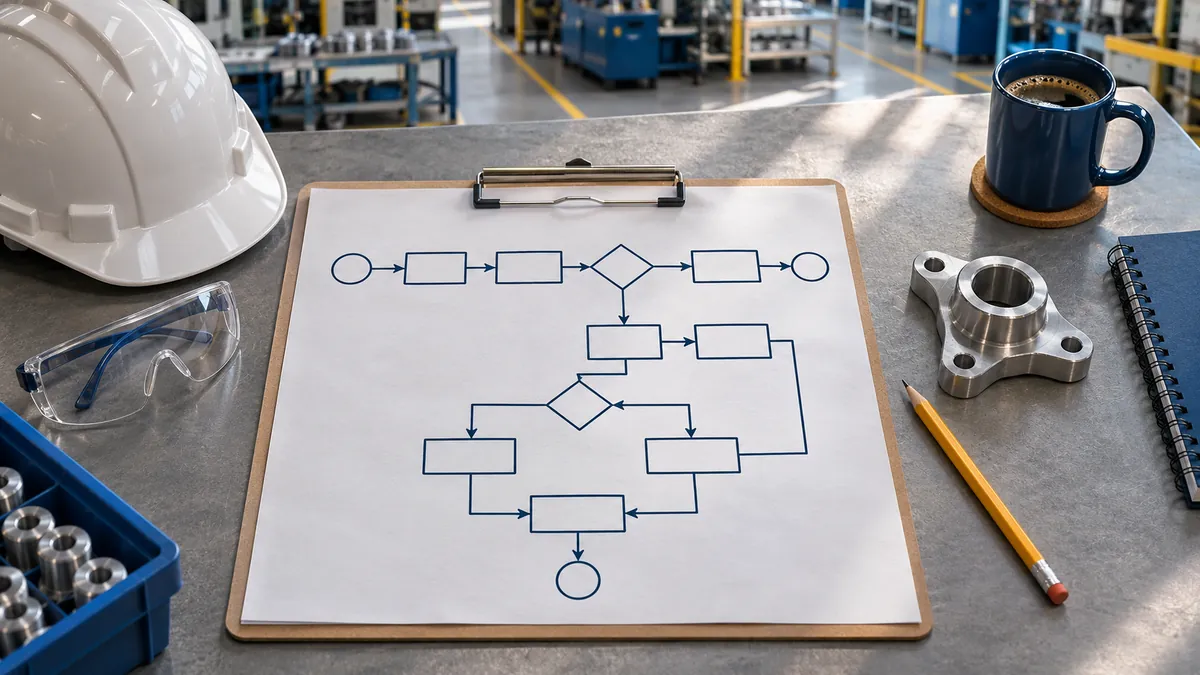
The Flow Process Chart (Process Flow Diagram) is one of the most powerful and underused tools in modern industrial engineering. While a time study measures how long an operation takes, the Flow Process Chart reveals what is happening at each step, identifying structural waste that even the best time study cannot detect on its own.
In this article we explore this fundamental technique in depth, its relationship with the time study, and how to use CronometrasApp to integrate both approaches into a robust continuous improvement system.
What is the Flow Process Chart?
The Flow Process Chart is a graphic and symbolic representation of the complete sequence of activities that make up a process. It was originally developed by Frank and Lillian Gilbreth in the early twentieth century and later standardized by the International Labour Organization (ILO).
Unlike a conventional flow diagram that shows decisions and alternative routes, the Flow Process Chart focuses on the linear sequence of events experienced by a product, material or person throughout an entire process.
The five fundamental symbols
The system uses only five symbols to classify all activities:
| Symbol | Activity | Description | Typical color |
|---|---|---|---|
| ○ | Operation | Transforms or adds value to the material | Green |
| → | Transport | Movement from one place to another | Red |
| □ | Inspection | Verification of quality or quantity | Yellow |
| D | Delay (Delay) | Waiting without action | Blue |
| ▽ | Storage | Controlled storage | Orange |
Each activity is recorded with its duration, distance traveled (for transports), and a description of what occurs.
The relationship between the Flow Process Chart and the Time Study
This is a critical distinction that many professionals overlook: first you map, then you time.
The correct order of application is:
- Map the complete process with the Flow Process Chart
- Eliminate the unnecessary operations identified
- Combine operations that can be performed simultaneously
- Rearrange the sequence for greater efficiency
- Simplify the remaining operations
- Time only the operations that survived the analysis
This approach, known as the ECRS principle (Eliminate, Combine, Rearrange, Simplify), guarantees that we never time activities that should not exist.
The process efficiency formula
The efficiency of a process is calculated with the following expression:
Where is the number of value-added operations and is the sum of all activities (operations + transports + inspections + delays + storages).
An efficient process typically has an efficiency above 40%, while processes with a great deal of improvisation usually fall below 15%.
Step-by-step methodology for building a Flow Process Chart
Step 1: Define the scope
Before starting, clearly establish:
- Start of the process: From exactly what point does it begin?
- End of the process: Where does it conclude?
- Object of study: Is it a product, a material, a document or a person?
- Level of detail: What constitutes an "operation" in your context?
Step 2: Observe and record
Walk through the entire process physically with a recording form. For each activity, determine:
- Description: What exactly happens?
- Symbol: Is it an operation, transport, inspection, delay or storage?
- Time: How long does it last? (this is where CronometrasApp is invaluable)
- Distance: How many meters are traveled? (only for transports)
- Quantity: How many units are processed?
Step 3: Build the diagram
The standard format of the Flow Process Chart organizes the information in columns:
| No. | Description | Symbol | Time (min) | Distance (m) |
|---|---|---|---|---|
| 1 | Raw material receipt | ▽ | 0 | - |
| 2 | Transport to cutting area | → | 2 | 35 |
| 3 | Cutting of parts | ○ | 4.5 | - |
| 4 | Dimensional inspection | □ | 1.2 | - |
| ... | ... | ... | ... | ... |
Step 4: Summarize and analyze
When finished, prepare a summary with the totals:
Where is the total number of activities and is the number of transports.
Practical example: Electronic component assembly process
Let us analyze a simplified real case. An electronics company produces control modules with the following process:
Current state (Before)
| No. | Description | Symbol | Time | Distance |
|---|---|---|---|---|
| 1 | PCB receipt in warehouse | ▽ | 480 min | - |
| 2 | Transport to assembly line | → | 3 min | 45 m |
| 3 | Visual inspection of the PCB | □ | 0.8 min | - |
| 4 | Wait for SMD component | D | 15 min | - |
| 5 | SMD component assembly | ○ | 2.3 min | - |
| 6 | Transport to reflow oven | → | 1.5 min | 12 m |
| 7 | Reflow (soldering) | ○ | 5.0 min | - |
| 8 | Cooling wait | D | 3.0 min | - |
| 9 | Transport to AOI inspection | → | 2.0 min | 20 m |
| 10 | AOI inspection | □ | 1.5 min | - |
| 11 | Transport to manual assembly | → | 1.0 min | 8 m |
| 12 | Connector assembly | ○ | 3.2 min | - |
| 13 | Functional inspection | □ | 2.0 min | - |
| 14 | Rework (if it fails) | D | 8.0 min | - |
| 15 | Transport to packing | → | 1.5 min | 15 m |
| 16 | Packing and labeling | ○ | 1.8 min | - |
| 17 | Final storage | ▽ | 0 min | - |
Current state summary:
- Operations (○): 5 — 13.3 min
- Transports (→): 5 — 9.0 min, 100 m
- Inspections (□): 3 — 4.3 min
- Delays (D): 3 — 26.0 min
- Storages (▽): 2
- Process efficiency:
ECRS analysis
Applying the ECRS principle:
- Eliminate: The visual inspection of the PCB (step 3) can be eliminated if the supplier guarantees quality through certification
- Combine: The AOI inspection (step 10) and the functional inspection (step 13) can be combined at one station
- Rearrange: The connector assembly (step 12) can be performed before reflow to reduce handling
- Simplify: The rework (step 14) should be moved to the end as an exception, not as part of the main flow
Optimized state (After)
| No. | Description | Symbol | Time | Distance |
|---|---|---|---|---|
| 1 | PCB receipt (just-in-time) | ▽ | 5 min | - |
| 2 | Transport to integrated station | → | 2 min | 15 m |
| 3 | SMD + connectors assembly | ○ | 5.5 min | - |
| 4 | Reflow | ○ | 5.0 min | - |
| 5 | Cooling + transport | → | 3.0 min | 8 m |
| 6 | Integrated inspection (AOI + functional) | □ | 2.5 min | - |
| 7 | Packing and labeling | ○ | 1.8 min | - |
| 8 | Storage/shipping | ▽ | 0 min | - |
Optimized state summary:
- Operations (○): 3 — 12.3 min
- Transports (→): 2 — 5.0 min, 23 m
- Inspections (□): 1 — 2.5 min
- Delays (D): 0
- Process efficiency:
Quantitative results
How to integrate CronometrasApp into process mapping
CronometrasApp offers functionalities that complement the Flow Process Chart perfectly:
1. Time study by element within each operation
Once the value-added operations have been identified in the Flow Process Chart, use CronometrasApp to break each one down into measurable elements. The app allows you to create data collection templates tailored to each type of operation.
2. Recording transport and waiting times
Transport and delay activities can be timed directly with the time study by elements function, assigning frequencies to each trip or wait.
3. Automatic calculation of standard times
After mapping and time study, CronometrasApp automatically calculates the standard times by applying the ILO allowance tables and the necessary performance rating factors.
4. Export for comparative analysis
The data can be exported to Excel to create before/after comparisons like the ones shown in the previous example. This is essential for presenting results to management.
Variants of the Flow Process Chart
Flow Process Chart of materials
Records the sequence of activities experienced by the raw material or components throughout the production process. It is the most common variant in manufacturing.
Flow Process Chart of people
Documents the activities of a specific operator. Useful for analyzing travel, idle time and unnecessary movements of personnel.
Flow Process Chart of information
Tracks the flow of documents or data through an administrative process. Increasingly relevant with the digitalization of processes.
Common mistakes when preparing a Flow Process Chart
1. Not including all the transports
Many analysts forget internal transports: moving material from one machine to the next, transporting between departments, or even walking to fetch tools. Every meter counts.
2. Confusing operation with inspection
An operation transforms the product (it adds value). An inspection only verifies. If a step does not modify the product, it is an inspection, not an operation.
3. Ignoring delays
Waiting times are usually the greatest waste in a process. A 15-minute delay between 2-minute operations means that 88% of the total time is non-productive.
4. Not documenting the distance
The distance in transports is crucial for evaluating the plant layout. A 5-minute transport may be acceptable if it covers 200 meters, but unacceptable if it is only 5 meters.
5. Mapping only the "happy path" flow
The real process includes rework, rejects and exceptions. Include at least the most frequent alternative flows to obtain a realistic picture.
Integration with other lean tools
The Flow Process Chart does not work in isolation. It complements naturally with:
Spaghetti Diagram
While the Flow Process Chart shows the time sequence, the spaghetti diagram reveals the physical route through the plant. Together they offer a complete view of waste in transports.
Value Stream Mapping (VSM)
The Flow Process Chart is a detailed breakdown of what is shown in the VSM as a single process box. The VSM gives the macro view; the Flow Process Chart, the micro view.
Value analysis
After classifying activities as value added / non-value added / necessary but non-value added, value analysis prioritizes what to eliminate first.
Multiple Activity Chart
For processes with several operators or machines working in parallel, the multiple activity chart shows the time coordination between them, complementing the sequential Flow Process Chart.
Application in specific sectors
Discrete manufacturing
In assembly lines, the Flow Process Chart reveals bottlenecks between operations and excessive transport times between workstations. Optimization typically reduces lead time by 30-50%.
Chemical processes
For batch plants, the chart maps the charging, reaction, discharging and cleaning phases. Delays (waits between phases) usually account for 40% of the total time.
Logistics and warehouses
The materials chart from receipt to dispatch identifies every intermediate storage point and redundant transport. In warehouses, distance reduction can reach 60%.
Services and administration
The information chart for administrative processes (approvals, paperwork, invoicing) reveals the enormous amount of delays and double checks typical of these environments.
How to calculate the number of observations required
For the times recorded in the Flow Process Chart to be statistically valid, we must determine the minimum number of observations. The formula is:
Where:
- = number of observations required
- = z value for the desired confidence level (1.96 for 95%)
- = standard deviation of the preliminary observations
- = mean of the preliminary observations
- = maximum acceptable error (typically 5% or 0.05)
CronometrasApp can help you perform these calculations automatically when you carry out multiple measurement cycles.
Software and tools for the Flow Process Chart
CronometrasApp
The ideal tool for the time study phase within the mapping. It allows you to collect data in real time, calculate standard times and export results.
Drawing tools
For the graphic representation, you can use:
- Pre-designed paper templates (ILO format)
- General-purpose diagramming software
- Spreadsheets with a predefined format
The importance of the visual format
The Flow Process Chart must be visually clear. A good chart allows you to identify waste at a glance: too many transport symbols suggest layout problems; too many delays indicate scheduling or capacity problems.
Conclusion
The Flow Process Chart is the fundamental tool that every industrial engineer must master before conducting a time study. Its power lies in its simplicity: just five symbols to classify any activity, but its impact is transformative when applied rigorously.
The key to success lies in the correct order: map first, eliminate waste, and only then time what remains. This approach guarantees that your time study focuses exclusively on value-added activities, maximizing the return on the analysis effort.
With tools such as CronometrasApp, the complete cycle from mapping through to the calculation of standard times is carried out smoothly and professionally, enabling organizations to build sustainable, data-driven continuous improvement systems.
Don't want to do it yourself? We do it for you from €800
If you prefer to outsource it, Cronometras delivers a complete time and motion study from a single video: elemental breakdown, OIT/TAL fatigue allowances, standard time with tolerances, and a report in PDF + Excel + JSON ready to present to management.